
Climate change
Deep Climate exists because our world is changing very fast, the climate is changing and we need to understand how to reduce our pollution and the impact on humans. Here you will find some information about the current conditions, the facts, but also the hopes we can have.
This is part of the models demonstrated by the Intergovernmental Panel on Climate Change (IPCC), which projects different scenarios ranging from the least worst case (1.5°C) to the worst case (at +5°C or more). The efforts we need to make to reduce our emissions are aimed at not exceeding, or at least minimising, this 1.5°C of global warming.
Temperatures, what are we talking about?
Talking about climate change usually means talking about temperature: the famous 1.5°C that should not be exceeded in order to keep our planet, life and societies in an acceptable state. This figure indicates a global warming of the entire planet (see ‘climate change’ for more information).
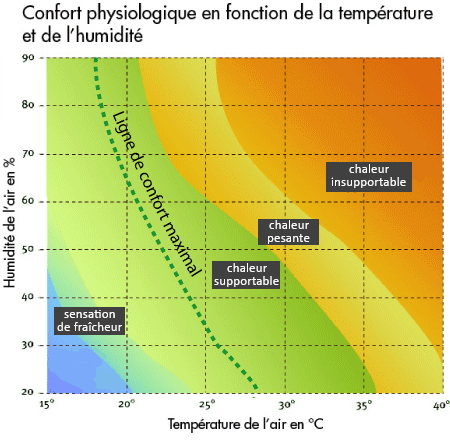
But on our scale, this does not mean that we will see our thermometers rise by one degree. The impact of the changes is much greater, and very different in different parts of the world or even in different countries. And talking about an isolated temperature doesn’t say much about the impact on a living body and therefore on human health. When we hear a temperature it is important to know if we are talking about a peak, an average, a duration of condition, how it was measured and more importantly, to know other data that must be correlated to identify the dangerousness of an environmental condition. A temperature of 30°C with 50% or 90% relative humidity has absolutely nothing to do with it.
In order to know and understand the risks of heat-related climate change, it is therefore necessary to know at least the actual temperature and humidity level and, more specifically depending on the conditions, the wind speed, the barometric pressure and the condition of the person facing these conditions.
Here we will define the terms, the indices, how they are measured and what they mean to us.
The measures
A climate or weather-related temperature is usually expressed in Celsius (°C) (more rarely in Fahrenheit °F in the USA).
To wit: The degree Celsius is determined (since 20 May 2019), by the International Bureau of Weights and Measures by a single fixed point at 0 °C corresponding to 273.15 Kelvin, which is the melting of water at standard pressure.
A temperature measurement should always be made between 1.5 and 2.5 metres above the ground to avoid the influence of the ground and ‘under cover’, i.e. protected from sun, wind and other external conditions. Basically, this means that the temperature of the ambient air is measured.
The wind can be expressed in several ways in knots, in Beaufort, in metres per second (m/s) or kilometres per hour (Km H) but it always expresses the same thing, that is to say a mass of gas (air is a gas) which moves in the atmosphere. This is an important piece of climate data, but on our scale it is extremely variable depending on our geographical position (valley, plateau, etc.) or whether we are protected or not.
Humidity is the presence of water molecules in the air. It is expressed in several ways depending on the needs:
The relative humidity of the air (expressed in %) is the partial pressure of the water vapour contained in the air over the saturation vapour pressure at the same temperature.
The absolute humidity (expressed in g/m3 ) is the water content in a gaseous mass such as air. For a given mass of air, at a given temperature, a maximum amount of water is possible beyond which it is theoretically no longer possible to add any water molecules.
This is the temperature, dependent on pressure and humidity, below which the water vapour in the air condenses on the surfaces due to the saturation effect. Dew point.
The indices
Wet bulb temperature or wet bulb temperature
Expressed in Tw, is a temperature that combines the temperature under shelter with the humidity in the air. It is physically measured with a thermometer, the tip of which is covered with wet muslin and blown to evaporate the water. This gives a reliable indicator of the condition of a living being during a period of humid heat.
Tableau de Thom (Indice Tw) : plus on monte vers le rouge, plus le risque est élevé pour un humain et rapidement mortelle sans mesure de protection dans la zone rouge vive. Ce qui arrive dès 35°C avec 100% d’humidité.
The Humidex
It is an index created by the Canadian army, recognised today as reliable. It also gives a temperature impacting a human being by correlating temperature and humidity, but the way it is calculated is very different from Tw, giving a different scale of measurement. It is therefore always necessary to know, when a figure is given, whether it is a humidex or Tw value.
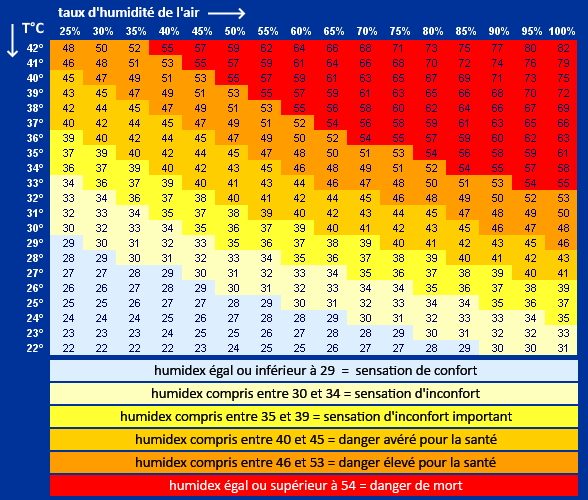
Tableau d’indice Humidex.
Windchill
It is an index that takes into account the temperature and speed of the wind, which cools the surface of the bodies with which it is in contact. For a given temperature, the higher the wind speed, the greater the feeling and the real impact of the cold. This increases the risk of frostbite, hypothermia and fatigue.
Resources, articles, data
6th IPCC Report 2021
6th IPCC Report 2021
The climate is changing very fast. We need your help to better understand the effects. Send us your testimonies to help us assess the feelings and impacts of the consequences of these situations.
You can simply send us an email via contact and tell us what you want or go further by filling in the form you find here: